Turn Chaos into Clarity. Make Every Click Count
Most websites collect data — but very few understand it. At Bixeltek, we don't just set up tracking; we engineer insight. We connect every digital touchpoint — from ads to forms to CRM — into a unified analytics ecosystem that reveals what truly drives conversions.
Unified Analytics Ecosystem
Conversion Intelligence
Actionable Insights
TRUSTED BY BUSINESSES WORLDWIDE
Platforms We Use


The Hidden Cost of Untracked Marketing
Every campaign you run without proper analytics leaks money. If you’re not tracking every click, form, or call, you’re paying for data you can’t use — and missing out on insights that could double your leads. At scale, that’s not a gap. That’s a blindfold.
- You don’t know which keywords bring revenue.
- You can’t see which pages convert visitors into leads.
- Your Google Ads and SEO teams operate in isolation.
- Your CRM is full of “leads” with no attribution trail.
- Data is the oxygen of growth. Without it, your marketing suffocates.
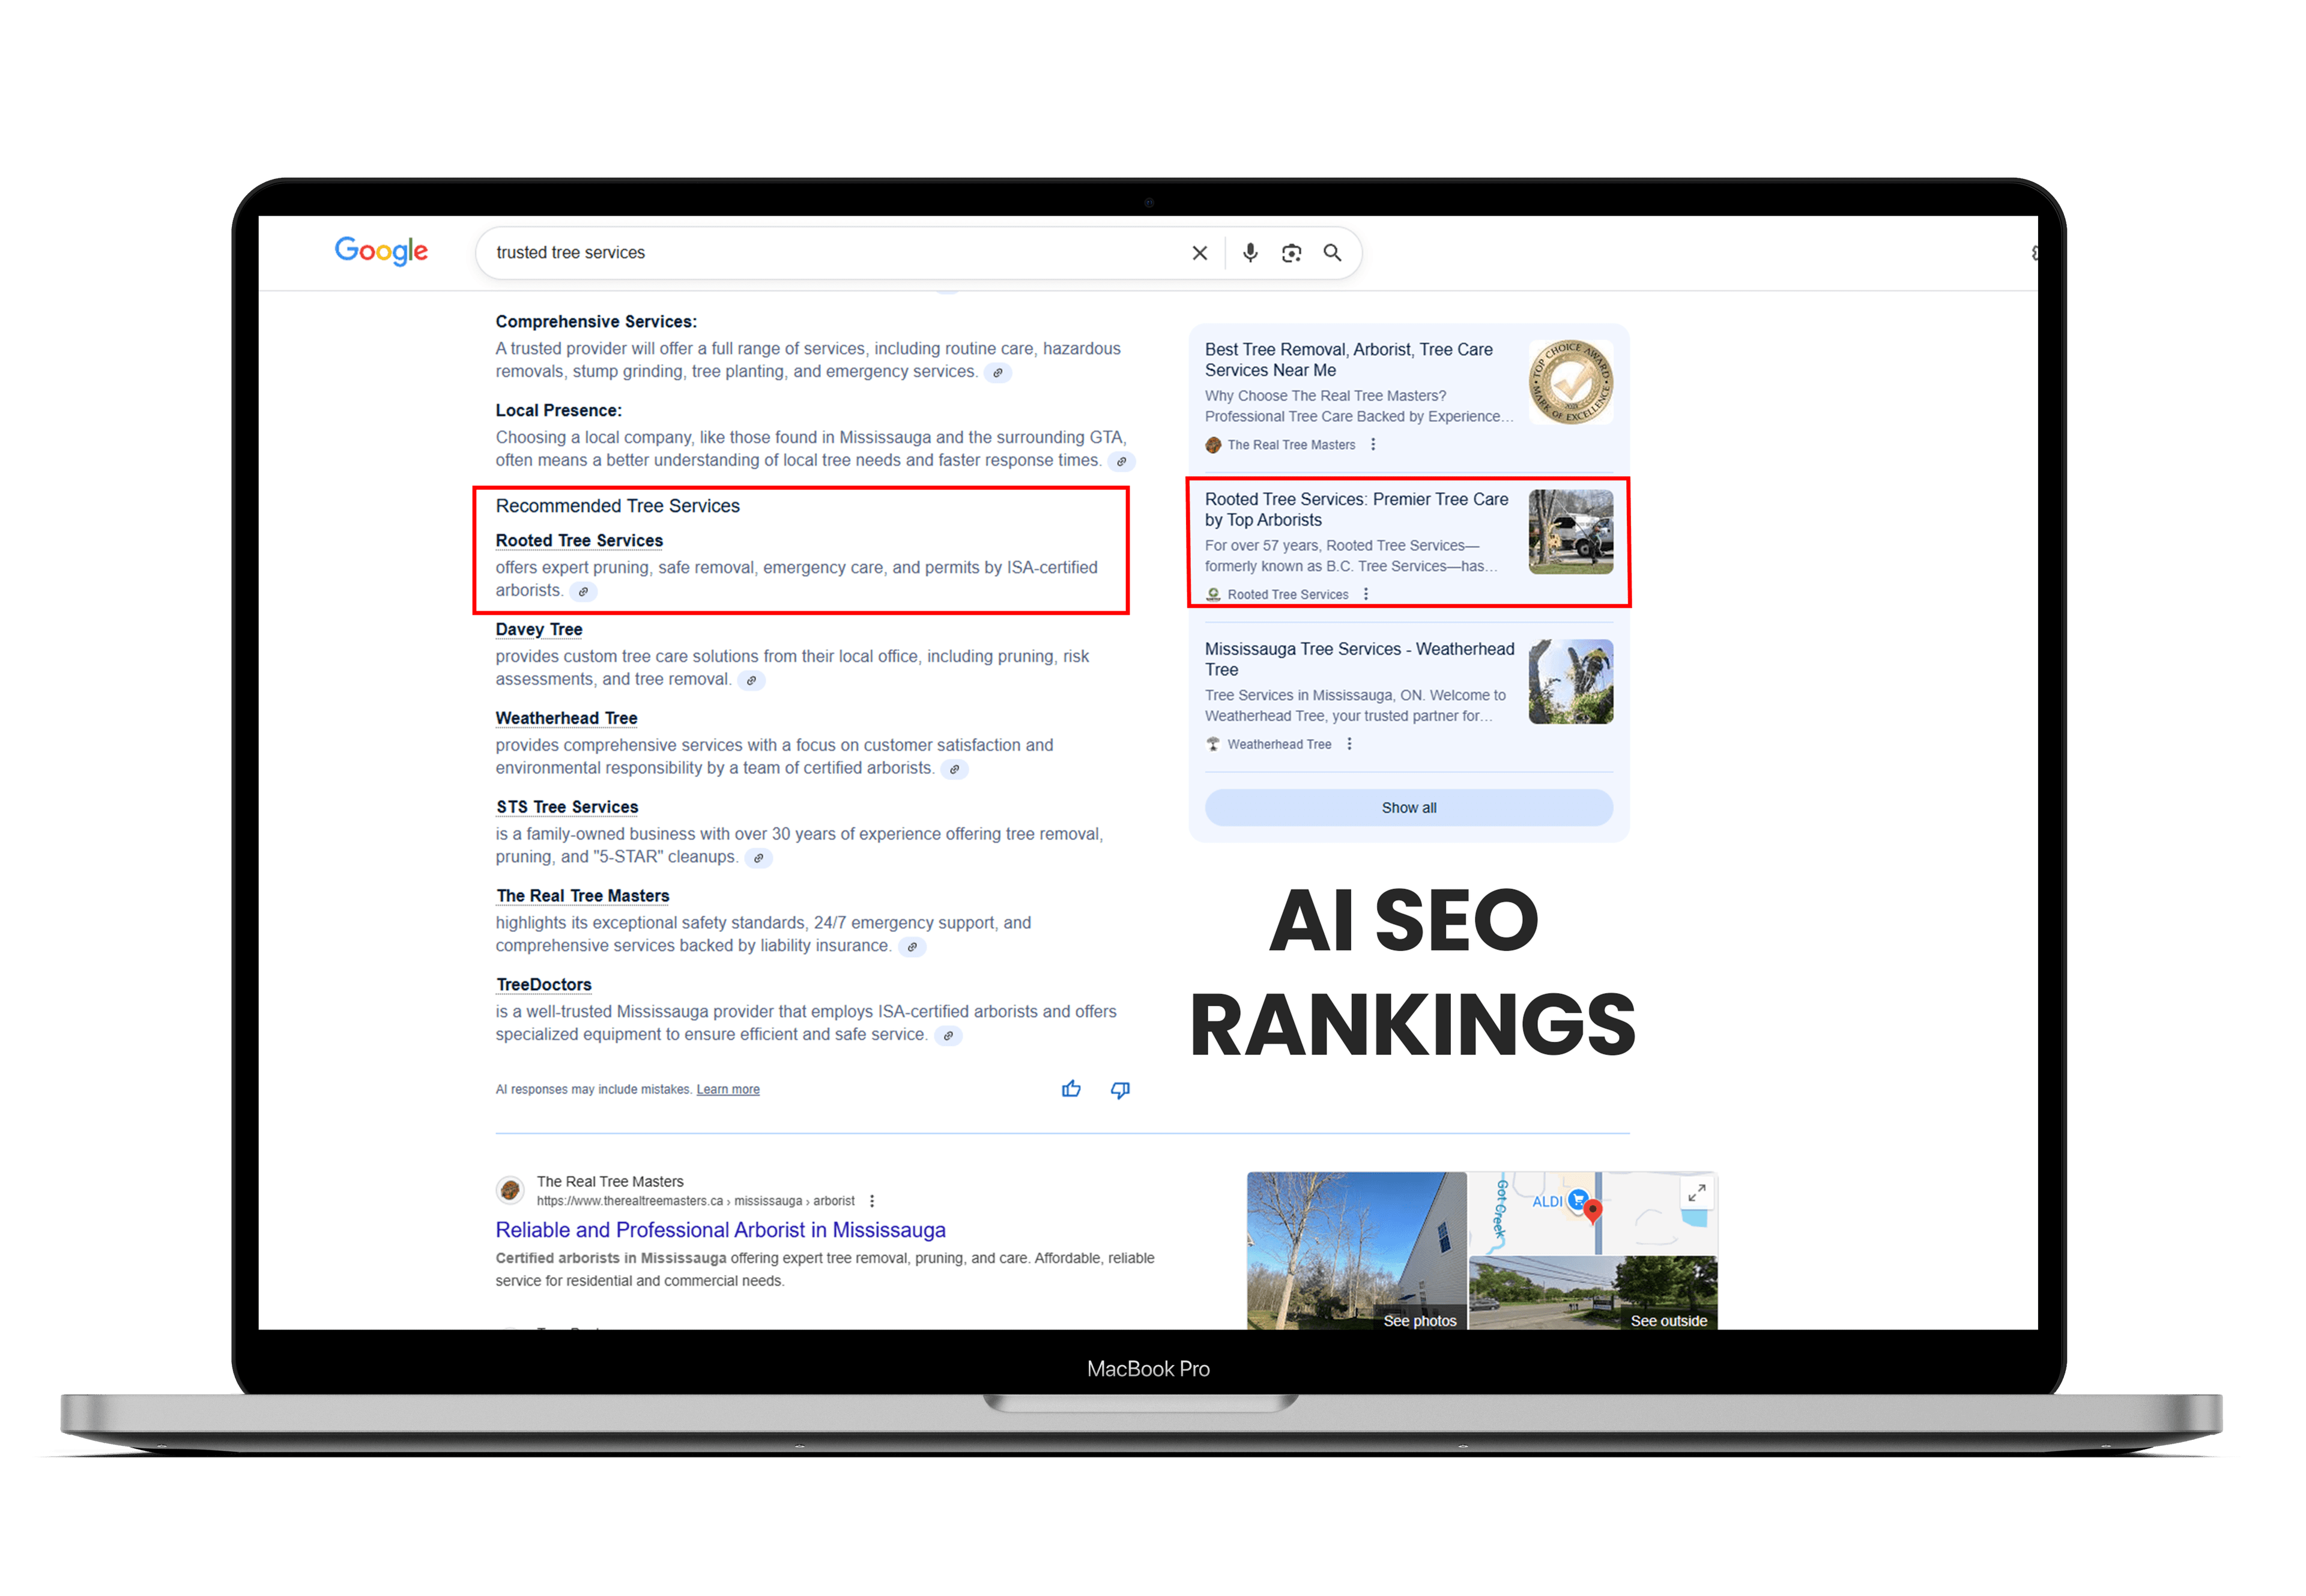
What We Mean by True Analytics
From Vanity Metrics to Conversion Metrics
Metrics like “sessions” or “impressions” mean little on their own. We focus on the micro-actions that create business outcomes: button clicks, call triggers, scroll depth, WhatsApp chats, video plays, form submissions, downloads.
Event-Based Tracking (GA4 Revolution)
Google Analytics 4 shifted the web from “pageviews” to “events.” We use that flexibility to capture meaningful behavior — not just traffic. For example:
- generate_lead events for form submissions
- click_call events for phone number interactions
- view_content events for service detail engagement
- conversion_value for e-commerce actions
Everything is mapped, measured, and visualized.
Reliable Analytics Foundation
We begin with a deep technical audit — verifying your tracking architecture across GA4, Tag Manager, Meta Pixel, LinkedIn Insight Tag, and CRM integrations.
Event duplication is removed
Parameters (source, medium, campaign) are unified
Cross-domain tracking is enabled
Consent and privacy compliance is intact
The result: your analytics foundation becomes reliable enough for strategic decisions.
Understanding User Behavior
We pair analytics with behavioral data to visualize user experience.
Heatmaps & Scrollmaps reveal where attention dies.
Session Recordings show actual user hesitation points.
Form Analytics pinpoint abandonment fields.
Click Distribution shows which CTAs are ignored.
When numbers meet behavior, patterns emerge — and that’s where optimization begins.
Mapping the Customer Journey
We map your end-to-end customer journey to locate friction points.
Ad Click → Landing Page → Engagement → Conversion → Retention
By visualizing this path, we locate friction — the “why” behind drop-offs.
Then, we redesign or re-sequence key funnel steps for smoother flow.
For e-commerce, compressing a 4-step checkout into 2.
For B2B, pre-qualifying leads before form submission.

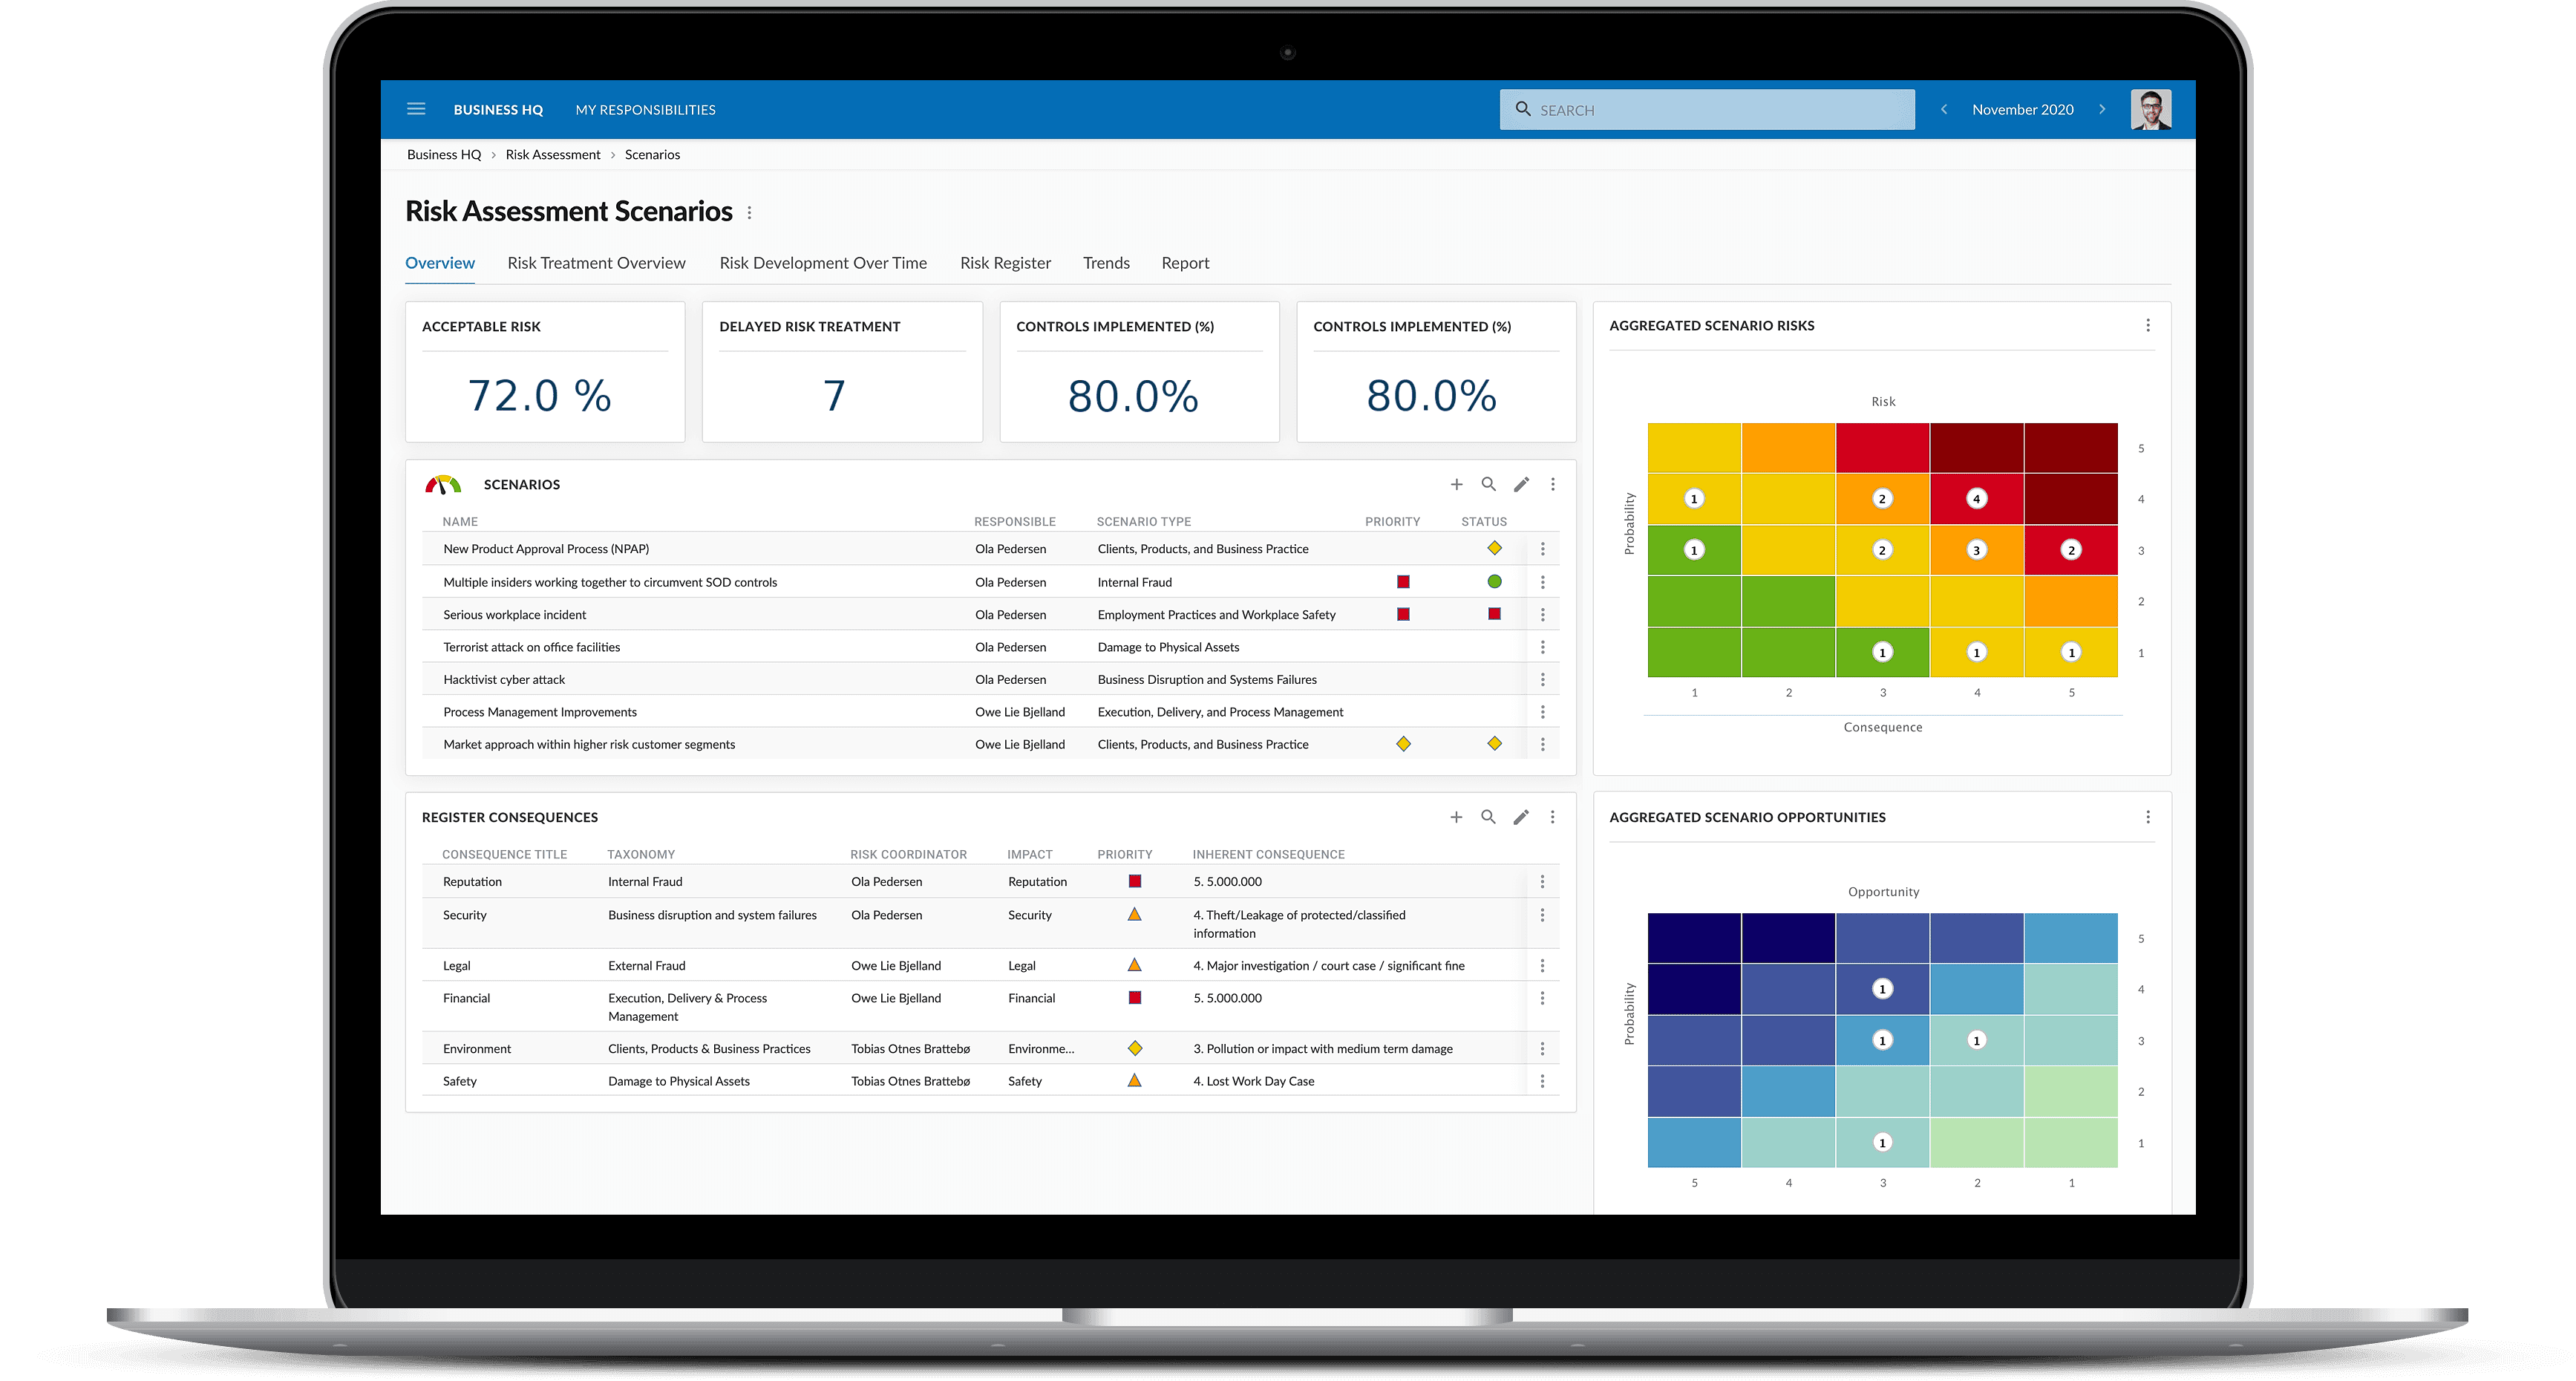
Scientific CRO
CRO isn’t about random tweaks. It’s the scientific method applied to marketing.
A/B or multivariate tests
Confidence intervals and sample size calculations
User cohort segmentation
Testable hypotheses validated systematically
We don’t guess. We prove.

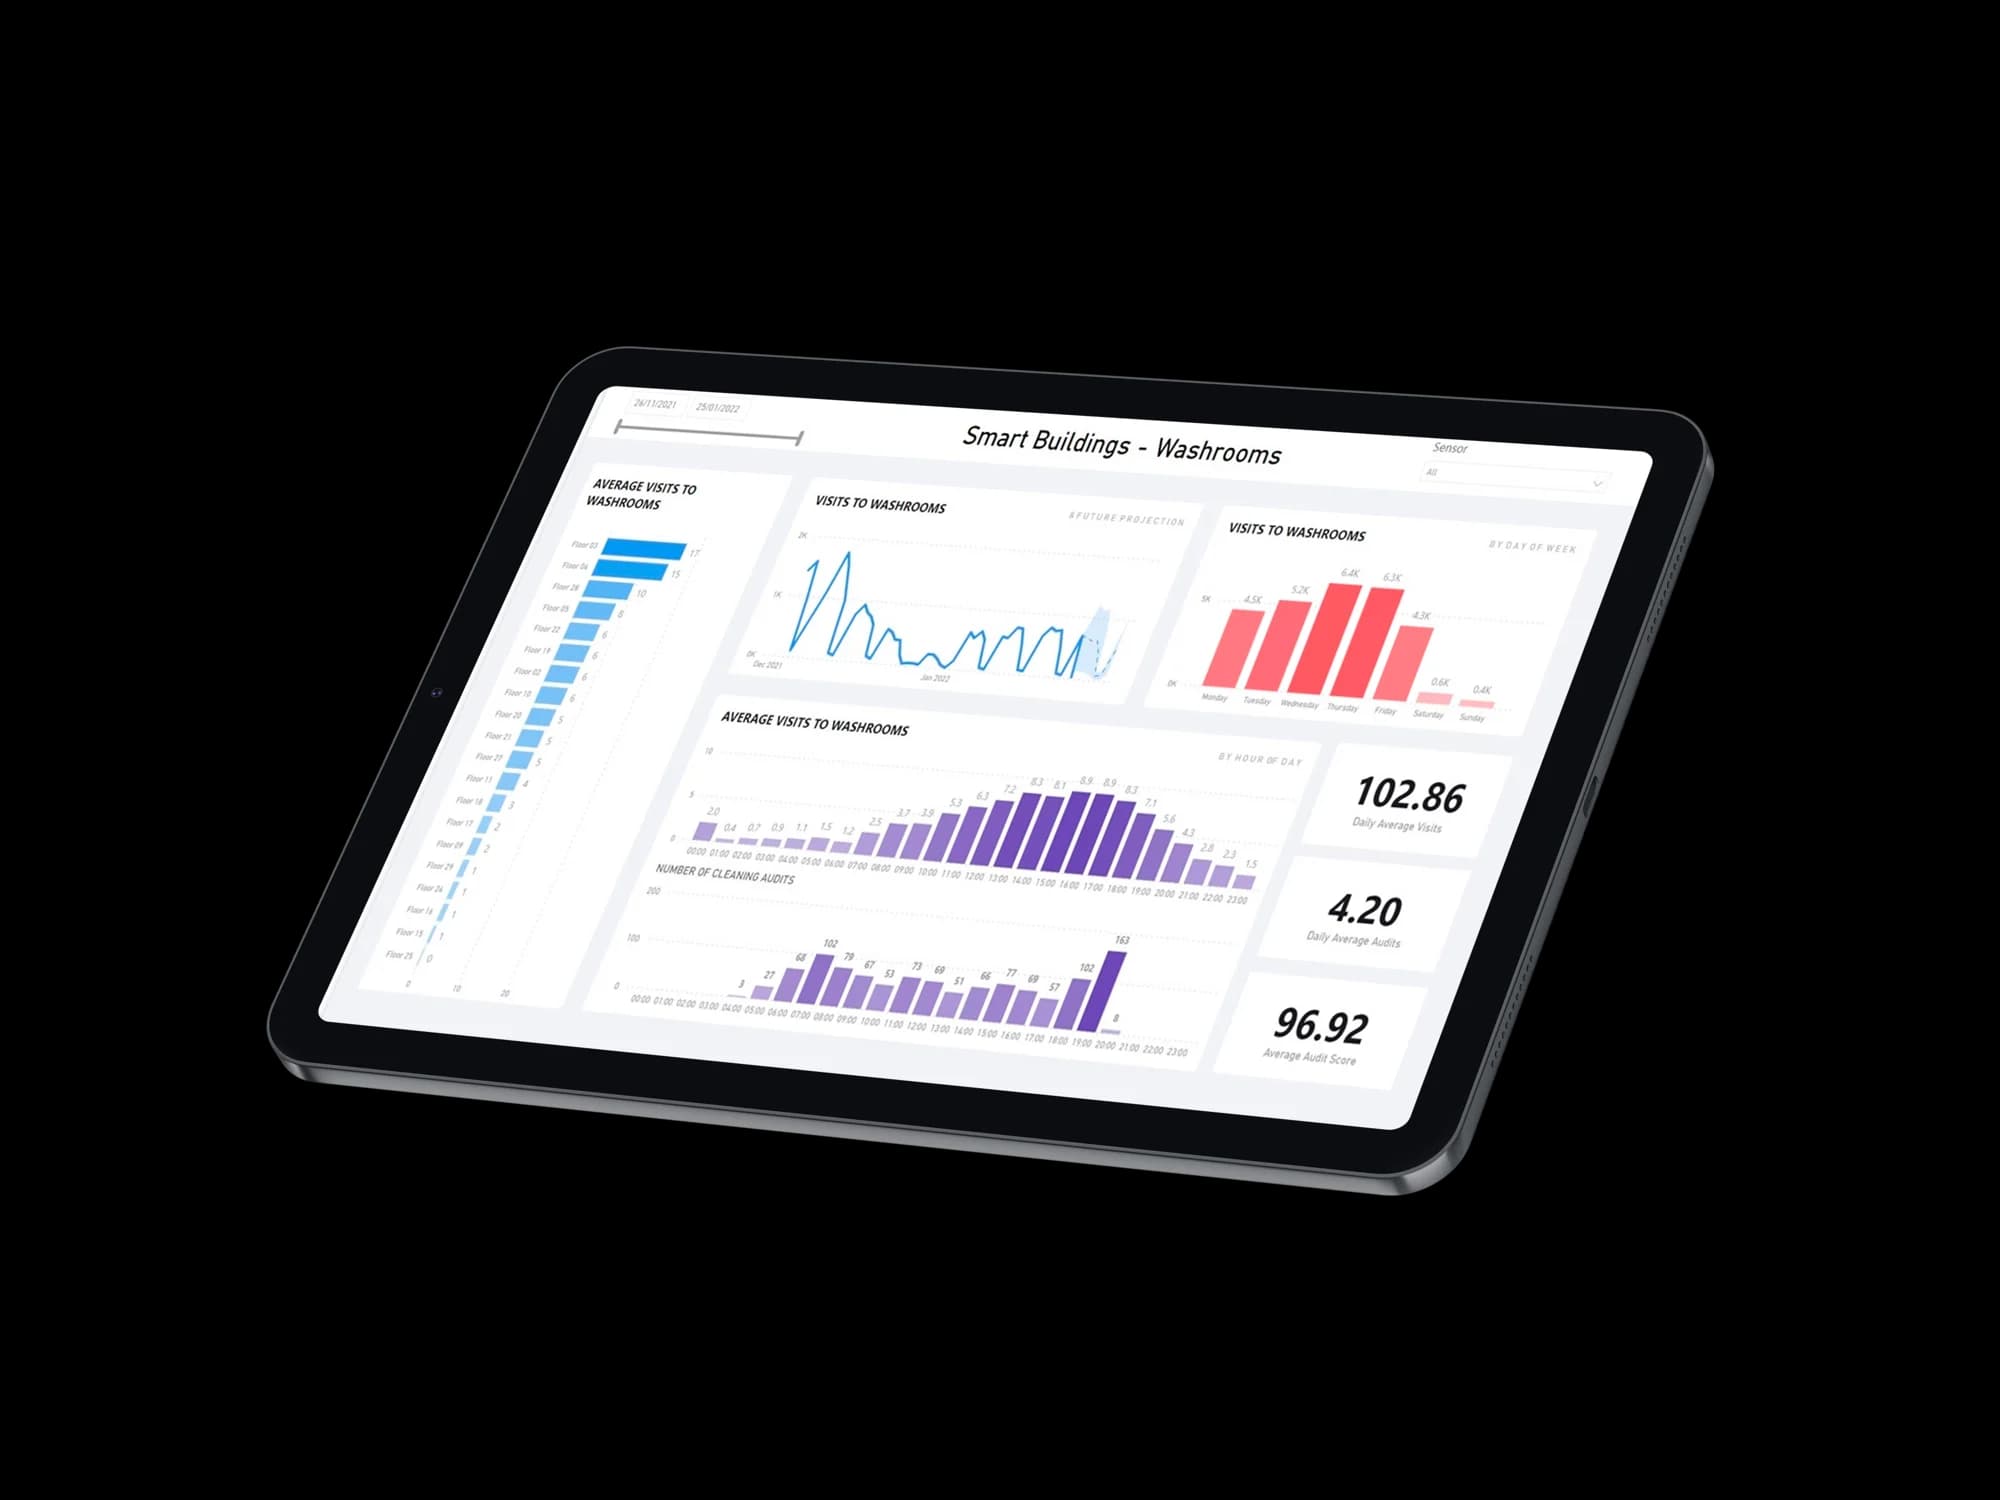
From Data to Insight
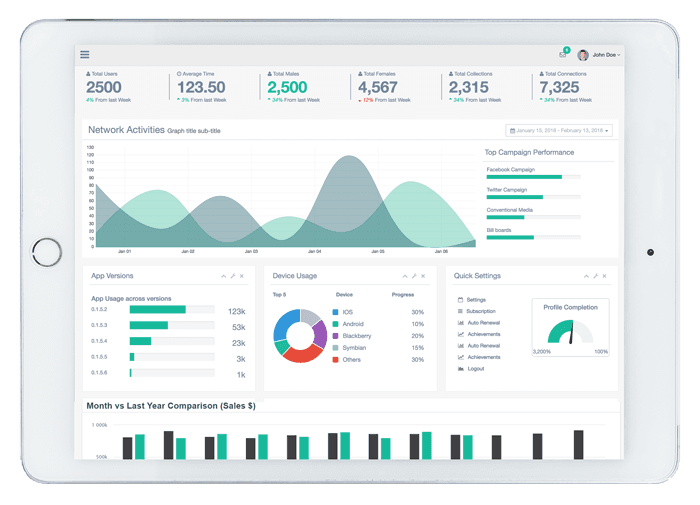
Our Looker Studio dashboards merge GA4, Search Console, Ads, and CRM into one cohesive story.
Funnel conversion rates
Device & demographic breakdowns
Keyword → Landing Page → Lead flow
Cost per conversion (cross-channel)
Data stops being abstract; it becomes insight you can act on.
Our Process in Practice
From audit to reporting, we follow a structured, scientific approach to Conversion Rate Optimization. Each step builds upon the previous to create measurable improvements.
01
Discovery Audit
We assess your current tracking and data flow to identify gaps, redundancies, and opportunities for accurate measurement and insights.
02
Implementation
GA4, Tag Manager, and dashboard setup are implemented to ensure all events, conversions, and interactions are tracked reliably for analysis.
03
Behavioral Analysis
We analyze user behavior with heatmaps, funnels, and UX diagnostics to uncover friction points and optimization opportunities.
04
Testing & Optimization
Hypothesis-based improvements are executed through A/B testing, multivariate testing, and cohort analysis to scientifically validate results.
05
Reporting & Scaling
Dashboards and strategy refinement provide actionable insights that drive conversion improvements and scalable growth.
01
Discovery Audit
We assess your current tracking and data flow to identify gaps, redundancies, and opportunities for accurate measurement and insights.
02
Implementation
GA4, Tag Manager, and dashboard setup are implemented to ensure all events, conversions, and interactions are tracked reliably for analysis.
03
Behavioral Analysis
We analyze user behavior with heatmaps, funnels, and UX diagnostics to uncover friction points and optimization opportunities.
04
Testing & Optimization
Hypothesis-based improvements are executed through A/B testing, multivariate testing, and cohort analysis to scientifically validate results.
Each step reinforces the next — tracking informs insights, insights drive experiments, and experiments lead to measurable conversion growth.
Measurable Outcomes You Can Expect
Transform your analytics from data collection to actionable business intelligence that drives real growth and measurable results.
Full Transparency
Data-Driven Decision Making
No more 'we think this worked.' You'll know exactly which campaigns, pages, and audiences convert with precise attribution and clear performance metrics.
Key Benefit
Eliminate guesswork from marketing decisions
Reduced Wasted Spend
Budget Optimization
Reallocate ad budgets based on verified conversion data and stop pouring money into channels that don't deliver measurable business results.
Key Benefit
Maximize marketing ROI efficiently
UX That Converts
Behavior-Driven Design
Behavioral insights lead to frictionless user journeys and improved trust signals that naturally guide visitors toward conversion actions.
Key Benefit
Higher conversion rates through better UX
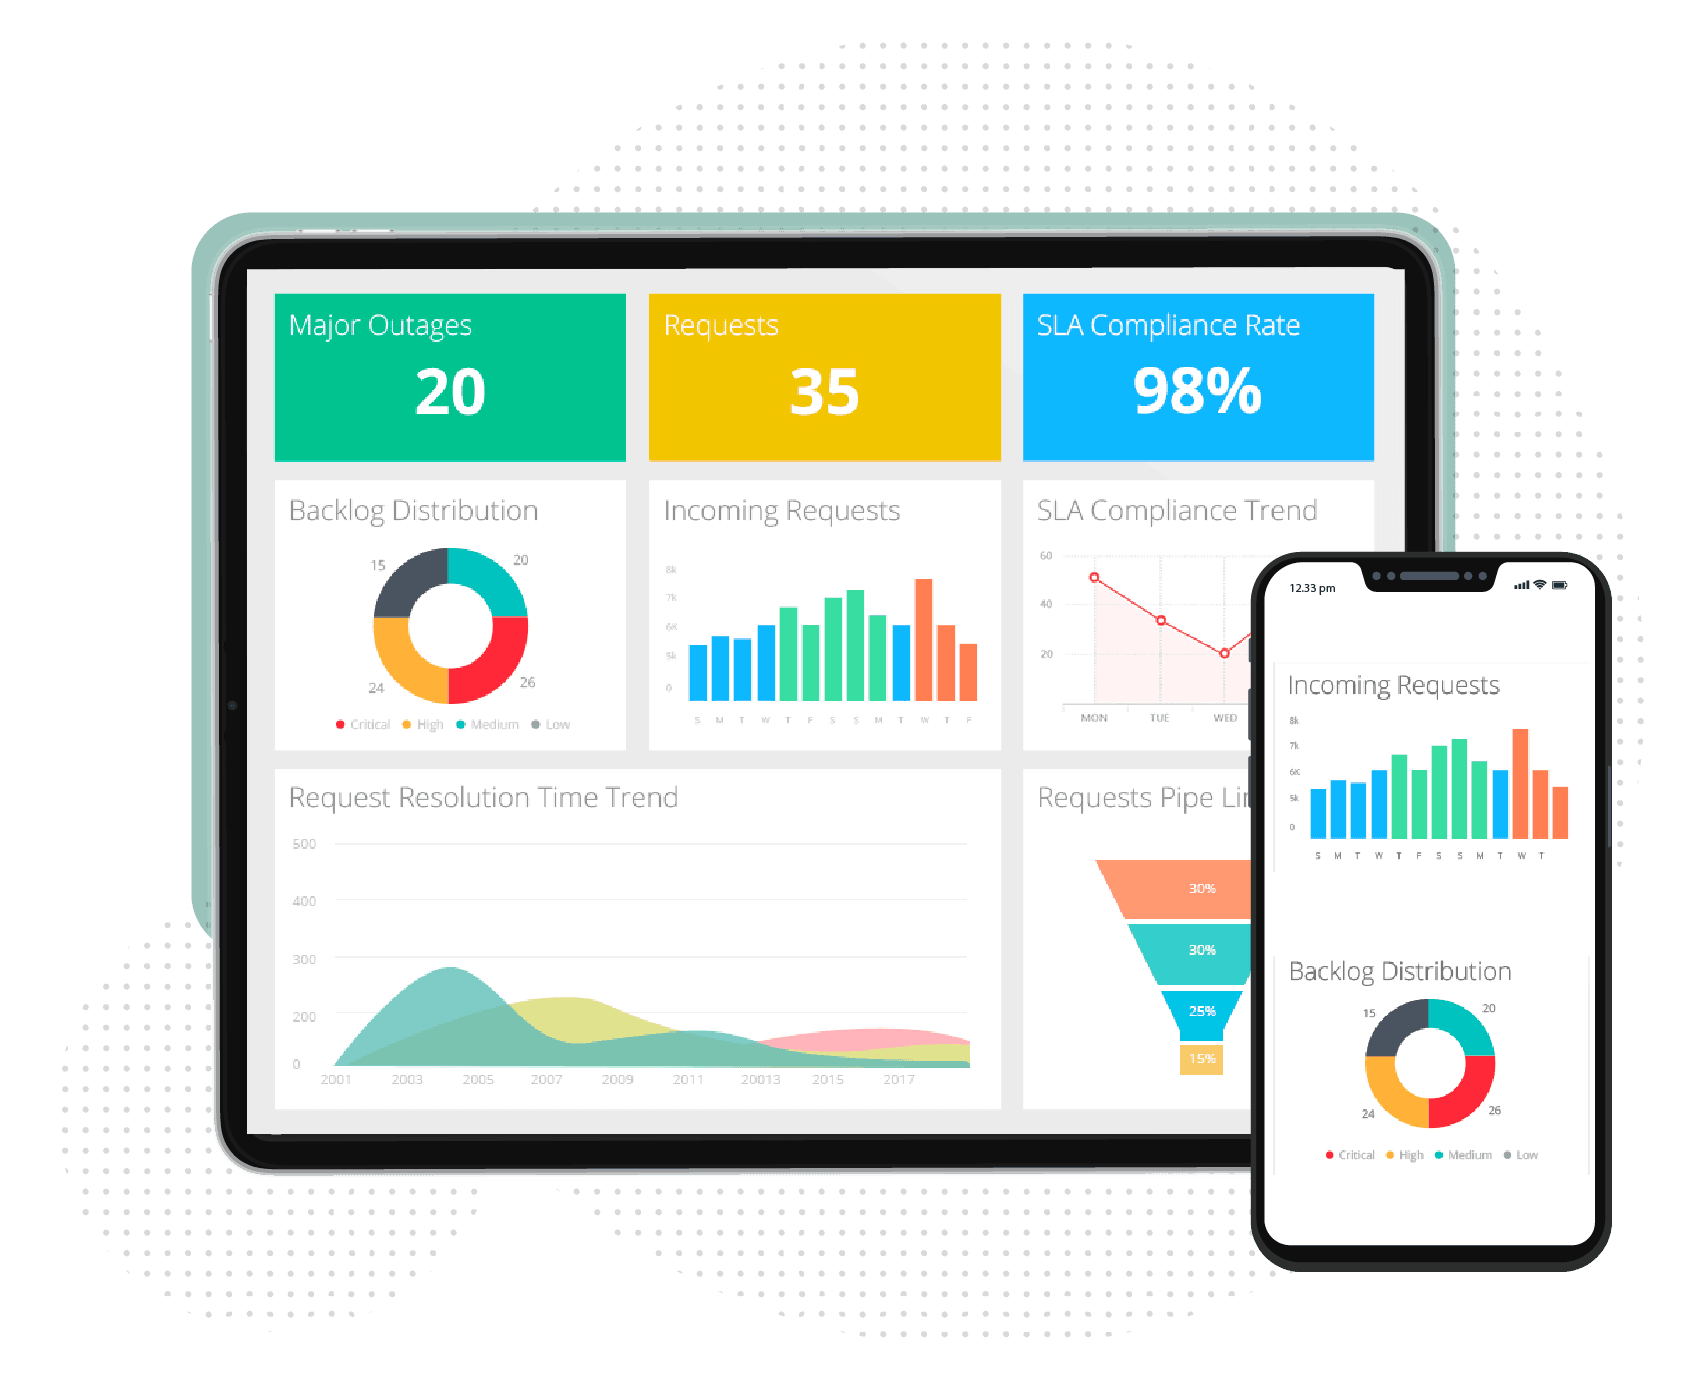
Actionable Dashboards
Real-Time Performance Monitoring
Daily performance snapshots at a glance with automated reporting that eliminates manual data compilation and spreadsheet management.
Key Benefit
Instant access to key metrics
Continuous Improvement Loop
Optimization Framework
Analytics fuels testing → testing improves conversion → improved conversion fuels marketing ROI in a perpetual cycle of growth.
Key Benefit
Sustained performance improvement
Competitive Intelligence
Market Positioning Insights
Understand how your performance compares to industry benchmarks and identify opportunities to outperform your competitors strategically.
Key Benefit
Data-driven competitive advantage
Data Security & Compliance
Risk Mitigation
Ensure all data collection and processing meets regulatory requirements while maintaining the highest standards of data protection and privacy.
Key Benefit
Compliant and secure analytics
Automated Reporting
Time Efficiency
Eliminate manual reporting tasks with automated dashboards that deliver insights directly to stakeholders without technical overhead.
Key Benefit
Save hours on manual reporting
Customer Journey Mapping
Audience Understanding
Track complete customer journeys from first touch to conversion and identify key touchpoints that influence purchasing decisions.
Key Benefit
Complete customer journey visibility
Ready to achieve these measurable outcomes for your business?
Industry Use Cases
Our expertise spans industries that define the region's economy:

Healthcare & Dental Clinics
Rank for treatments, attract patients, and grow visibility.

Construction & Engineering
Generate high-intent B2B inquiries from organic traffic.

Industrial & Manufacturing Firms
Build supplier visibility and trust online.

E-commerce & Retail
Rank for products and drive consistent conversions.

Education & Training Institutes
Capture enrollments through search visibility and local maps.

Corporate & Consulting Firms
Build credibility and inbound visibility for brand trust.
Case Study Snapshot
Real data, real impact — replicated across verticals from retail to construction.
Dental Clinic
Toronto, Ontario

The Problem
High website traffic with low appointment bookings. Despite strong visibility, the conversion funnel was leaking potential patients at critical touchpoints.
Form Submissions
+34%
Cost Per Lead
-42%
Conversion Trend
Last 30 days
Booking Funnel